April 7, 2025
Last Wednesday, President Trump announced a new trade policy that includes a 10% tariff on all trading partners, along with additional “reciprocal” tariffs targeting countries with which the U.S. runs its largest trade deficits. The equity market has responded sharply, with the S&P 500 down more than 10% since the announcement, and close to 20% from its February high. While the tariff announcement was telegraphed, the scale of the rates imposed was much higher than what we and many others had anticipated. The manner in which the tariff rates were calculated was unconventional, and it is reasonable to expect that some of the higher rates will be reduced to more moderate levels. If the announced rates stand, the U.S. effective tariff rate would increase by about 20 percentage points. To put this into perspective, the revenue generated from the announced tariff rates would be comparable to a doubling of the corporate income tax rate, or roughly $600B.1
The sharp increase in trade barriers, combined with the potential for retaliatory tariffs from trading partners and uncertainty as to when policies will truly be finalized has meaningfully raised the risk of a recession. In response, markets have priced a more aggressive Federal Reserve policy path, with expectations for four rate cuts this year (up from two). Treasury yields have fallen, and investment grade fixed income has held up well which has offset some of the equity market volatility in portfolios.
We have been cautious about making significant changes to portfolios in response to policy headlines, recognizing that these policies can shift quickly, and market reactions can be sharp in either direction. For instance, this morning the market opened down about 4% from its Friday close. It then spiked 8% on a news report that suggested President Trump was considering delaying tariffs by 90 days, before retreating 5% after the White House denied the report.
In times like these, it’s especially important to zoom out and view the market through a long-term lens. Market drawdowns of 20% or more are relatively rare, and history shows that when they do occur, forward returns from those levels tend to be strong. While no one can predict the exact bottom, we believe there are some important differences from past crisis periods. Unlike in 2008, the banking system today is well capitalized, with higher liquidity buffers, stricter stress testing, and better underwriting standards. For example, U.S. banks entered this period with Tier 1 capital ratios near all-time highs, and the largest institutions maintain substantial reserves to withstand even severe economic shocks.
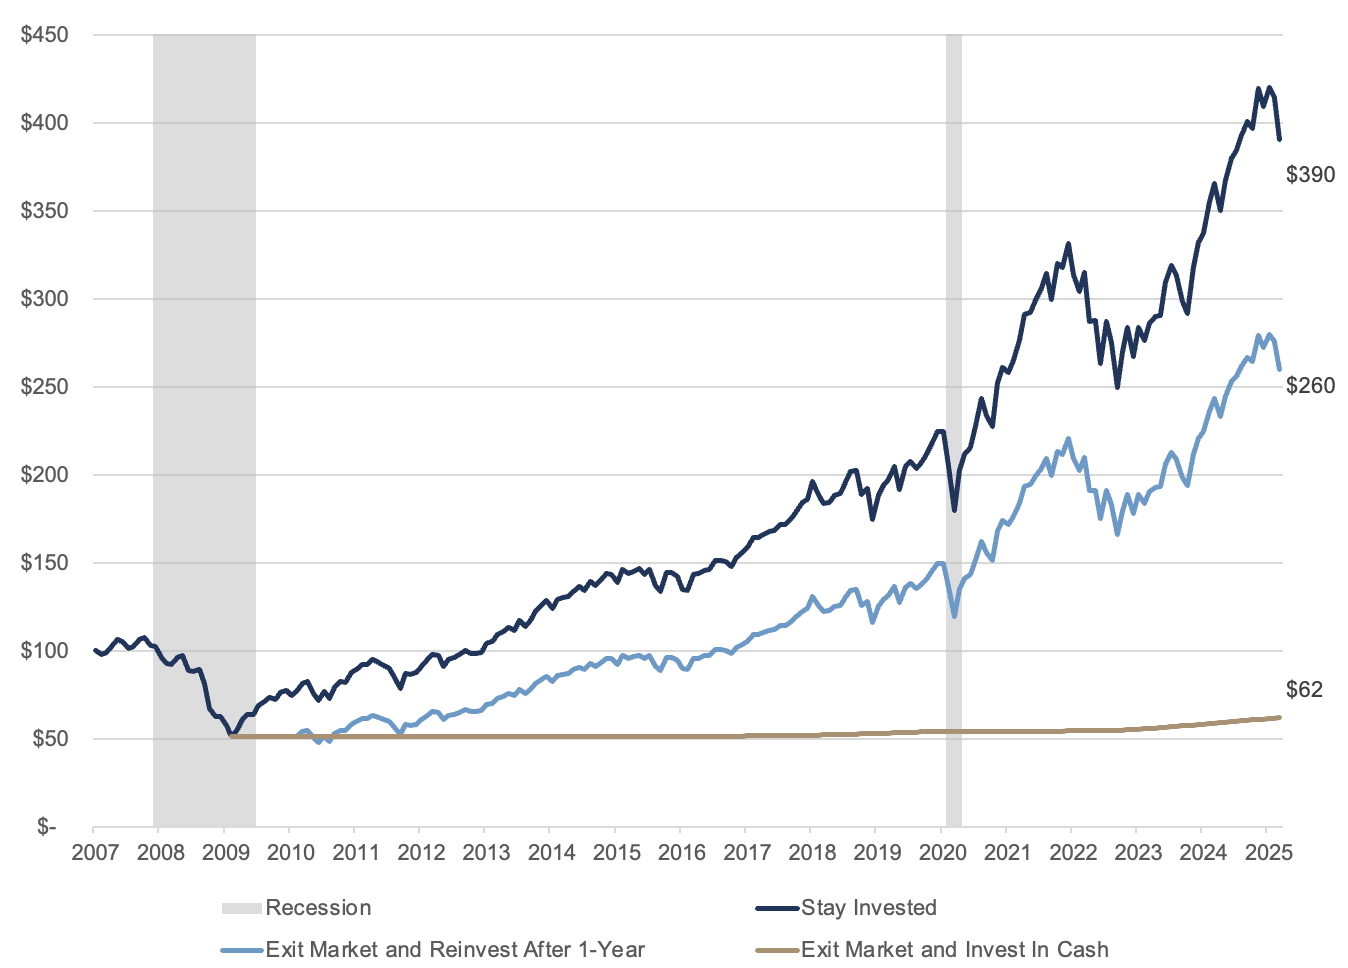
Exhibit A: Ending Wealth Values After 2008-09 Market Decline

Source: Morningstar, Fiduciary Trust Company. Returns from 1/1/2007-3/31/2025. The S&P 500 is used as a proxy for the stock market and US Treasury bills are a proxy for cash. Past performance is no guarantee of future results. This is for illustrative purposes only and not indicative of any investment. An investment can not be made directly in an index.
Today’s market swings are a reminder that this a fluid and fast-evolving situation. We would not be surprised to see modifications to the proposed tariffs in the coming days – such as individual countries negotiating bilateral agreements with the United States – or even legal challenges. We’ll also be closely monitoring upcoming congressional negotiations on the tax bill to see whether a portion of the tariff revenue might be used to offset reductions in corporate or individual tax rates.
Staying invested through turbulent periods has historically rewarded disciplined investors—and we believe this time will be no different.


